• インフラジスティックス・ジャパン株式会社: 050 (1745) 6258
  • マイアカウント
Infragistics Infragistics
メニュー
  • マイ アカウント
    • ログイン
  • 開発
    • おすすめパッケージ
      Infragistics Ultimate¥260,000
      (税抜)
      Web、モバイル、デスクトップアプリ構築のためのUX / UIツールキット完全版
      Infragistics Professional ¥180,000​
      (税抜)
      Web、モバイル、デスクトップ開発者向けの包括的なUIコンポーネントライブラリ
      Ignite UI¥160,000
      (税抜)
      Webアプリを構築するためのUIコンポーネント完全版ライブラリ
    • WEB向け
      App Builder(New) Ignite UI Angular Blazor React Web Components Ultimate UI ASP.NET Core Ultimate UI ASP.NET MVC Ultimate UI jQuery Ultimate UI for ASP.NET Web Forms
    • デスクトップ向け
      Ultimate UI for Windows FormsUltimate UI for WPF
      クロスプラットフォーム向け
      Ultimate UI for Uno Ultimate UI for UWP Ultimate UI for WinUI Ultimate UI for Xamarin
    • Design to Code
      App Builder(New)Indigo.Design UIキット
      初めてご利用の方
      会社・製品概要のご紹介
  • UX
    • App Builderドラッグアンドドロップで Web アプリケーションを構築できる ローコード デザインツール
  • BIツール
    • Reveal様々なプラットフォームで簡単にダッシュボード作成やデータ可視化が可能な、組み込み型データ分析ツール
    • Slingshotデータ、プロジェクト管理、コンテンツ、チャット。チームの可能性を最大限に引き出すタスク・プロジェクト管理ツール
  • サービス
    • サービスとサポートご利用ニーズに合わせたサービス・サポートメニューをご用意しております。
    • 有償技術支援UX/UIや開発についての各種有償技術支援サービスをご提供しております。
    • React入門
      オンデマンド技術トレーニング(New)Reactトレーニング入門編 基礎からライブラリ導入まで学べます。
    • WPF入門
      オンデマンド技術トレーニングWPFを利用した Windows アプリケーション開発を新たに行う場合に最適なトレーニングです。
  • リソース
    • 製品ヘルプ
    • ナレッジベース
    • サンプルアプリケーション
    • お客様導入事例
    • ウェビナー
    • オンデマンド動画
    • ホワイトペーパー
    • ブログ
  • ご購入
    • ご購入ガイド
    • プランと価格
    • サポート環境
    • サポートポリシー
    • サブスクリプションとは
    • サブスクリプション更新
    • 販売パートナー
    • 法的情報
    • FAQ
  • 資料請求
  • 無料トライアル
  • お問い合わせ
 
Xamarin | Controls
  • Download Trial
Your Privacy Matters: We use our own and third-party cookies to improve your experience on our website. By continuing to use the website we understand that you accept their use. Cookie Policy
OK
お客様のプライバシーに関する事項
当社では、Webサイトでのお客様の利便性を向上させるために、自社およびサードパーティのクッキーを使用しています。また、これらのクッキーを使用することで、ユーザーの行動を分析し、継続的にWebサイトを改善することができます。下記のCookieポリシーとCookie設定をご確認ください。
設定の管理 OK
プライバシー設定
Webサイトを訪問すると、ブラウザに情報が保存または取得されることがあります。この情報は、お客様、お客様の好み、またはお客様のデバイスに関するもので、ほとんどの場合、お客様が期待するようにサイトを動作させるために使用されます。この情報は通常、お客様を直接特定するものではありませんが、よりパーソナライズされたWeb体験を提供することができます。当社はお客様のプライバシーの権利を尊重するため、一部の種類のCookieを許可しないよう選択することができます。ただし、一部の種類のCookieをブロックすると、サイトの利用や提供できるサービスに影響を与える可能性があります。
すべて受け入れる
ログインデータと優れたサイトパフォーマンスのために必要なCookie
Webサイトの機能や特徴をサポートするCookie
Cookie は、当社のサードパーティの広告パートナーによって提供され、お客様の閲覧習慣に関する情報を収集します
Cookieは、広告メッセージをお客様やお客様の関心により適したものにするために使用されます
すべて拒否 選択内容を確認
  • Grids & Lists
    • Data Grid
  • Charts
    • Doughnut Chart
    • Category Chart
    • Data Chart
    • Funnel Chart
    • Pie Chart
    • Sparkline
  • Barcodes
    • QR Barcode
  • Frameworks
    • Excel Library
  • Gauges
    • Bullet Graph
    • Linear Gauge
    • Radial Gauge
  • Productivity Pack
    • App Map
    • Xamarin.Forms Toolbox
    • Configurators
  • Scheduling
    • Schedule
Easily bind multiple data series with the Xamarin Doughnut Chart control

Xamarin Doughnut Chart

The Xamarin Doughnut Chart displays multiple series using concentric rings, each of which represents a data series. Similar to a Pie Chart, the Doughnut Chart shows categorical statistics expressed in percentages. Easily configure the boundary of the hollow center, which can be left empty or labeled. Bind easily to data, display exploded slices, customize themes, and more with this well-rounded control.


Easily bind multiple data series with the Xamarin Doughnut Chart control

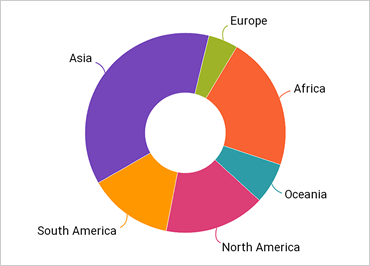
Multiple Ring Series & Data Binding

The Doughnut Chart supports one or more rings surrounding a hollow center. The center, which does not typically represent data, may either be a blank circle or may contain a label. Each ring represents a separate data series that you can data-bind to a data source via the ItemsSource property.


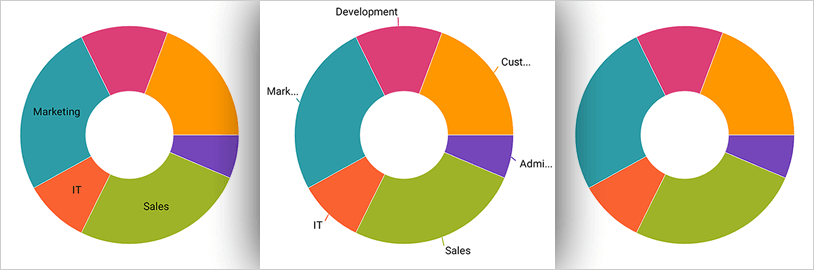
Configurable Inner Radius

You can configure the inner radius of the Doughnut Chart center by selecting the center as an object and extending the boundary, or via a property setting.

Configure the inner radius of the Xamarin Doughnut Chart

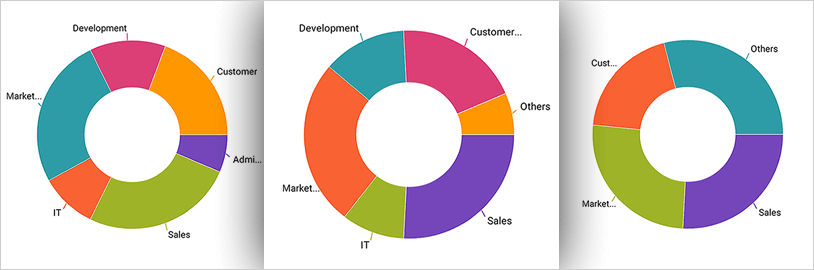
Slice/Selection Labeling

Control how slices or sections of the Doughnut Chart are labeled. Options for displaying labels are:

  • No labels
  • Labels displayed at the center inside of each section/slice
  • Labels displayed outside of each section/slice, with a configurable LabelExtent distance
  • A BestFit method that automatically chooses whether each label should be displayed inside or outside the chart
Control how slices or sections of the Xamarin Doughnut Chart are labeled

Slice Selection & Explosion

Exploded slices are disconnected and drawn at a distance from the origin; the distance is controlled via a configurable property. Slices can be selected or exploded programmatically or using touch and mouse gestures.

Xamarin Doughnut Chart slice selection and explosion

Others Category

The underlying data for a Doughnut Chart can often contain small-value items too numerous to display clearly via separate slices. With the Others category you can automatically aggregate several data values into a single slice. You can set the threshold to designate which values get their own slice and which values will be rolled under Others.

Aggregate several data values into a single slice with the Xamarin Doughnut Chart
  • 製品
    • 初めての方へ
    • 開発ツール
    • UXツール
    • データ可視化
    • コラボレーション
    • 無料トライアル
  • 購入について
    • ご購入ガイド
    • プランと価格
    • サブスクリプションとは
    • 販売パートナー
    • FAQ
  • ラーニング
    • ヘルプとAPIドキュメント
    • ナレッジベース
    • サンプルアプリケーション
    • ウェビナー
  • サポート
    • 製品ライフサイクル
    • サービスリリース情報
    • サポート環境
    • サポートポリシー
    • テクニカルサポートチャット
    • サービスヘルスダッシュボード
  • マイアカウント
    • サブスクリプションの管理
    • サポートアクティビティ
    • サポート要求の送信
  • 他社製品との比較
    • Ignite UI for Angular
  • 会社情報
    • 会社概要
    • ニュース
    • 採用情報
    • 法的情報
    • 提携パートナー
    • パートナープログラムへのお申し込み
メールマガジンのご案内

テクノロジーや弊社製品に関する最新情報、イベントやキャンペーン情報をお届けします!

購読する
  • プライバシーポリシー
  • クッキーポリシー
  • 利用条件
  • 特定商取引法に基づく表記
I.S. Partners SOC2 SEAL GDPR SEAL
© Copyright 2025 INFRAGISTICS. All Rights Reserved
Back to top of page