
Ignite UI Financial Chart
This lightweight, high-performance chart is easy to configure to display mission-critical financial data using a simple and intuitive API. Just bind your data, and the chart takes care of everything else. The Ignite UI Financial Chart control is part of Infragistics’ best-in-breed UI for building high-performance, high-volume financial services, and capital market data applications.
View SampleAutomatic Data Column Selection
The intuitive control automatically analyzes and selects data columns - Date/Time column to use for x-axis and Open, High, Low, Close, Volume columns or the first five numeric columns for the y-axis.
Visual Choices for Data Configuration and Display
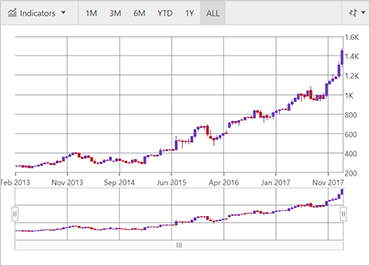
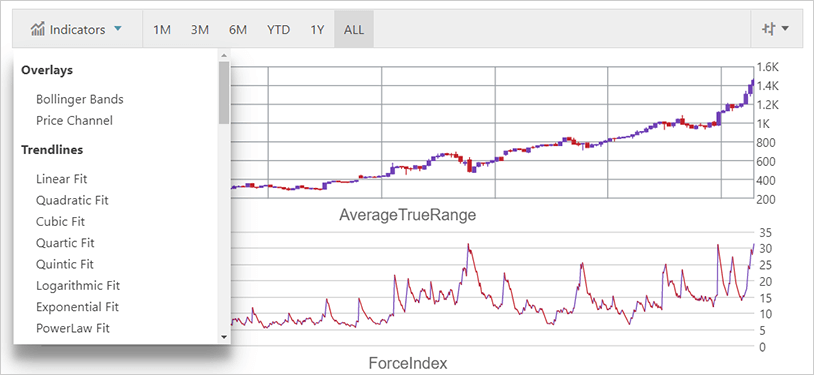
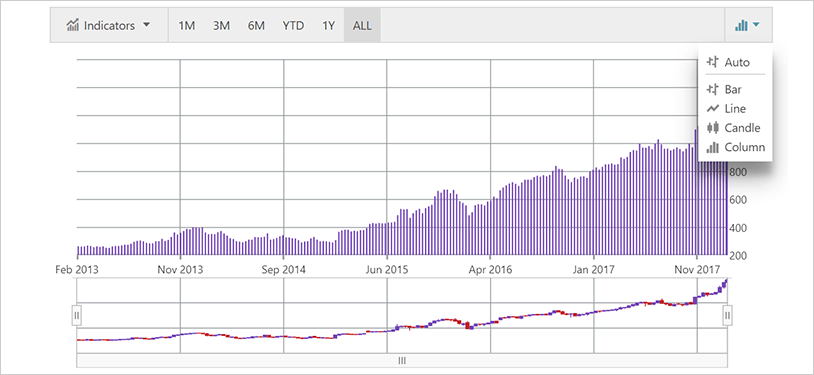
The Financial Chart features a toolbar that allows end users to choose display options and selectors. Other views are Prices View, Volume View for trading volume, Indicators View, and Navigation View with zoombar for previewing.
 View Sample
Options for Visualizing Data
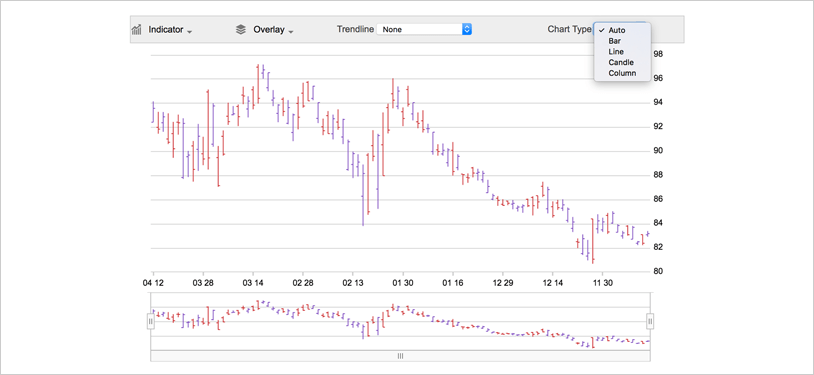
The chart gives users numerous ways to visualize and interpret data, including label formatting and multiple display modes for price, volume, and other financial indicators. Set the chartType to designate Bar, Candle, Column, or Line charts.
 View Sample
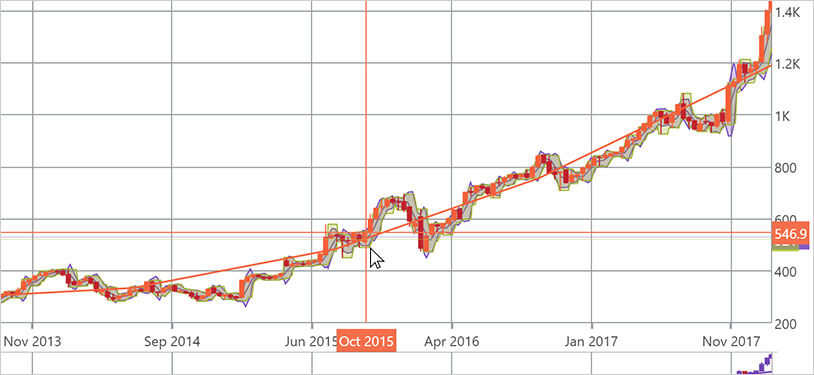
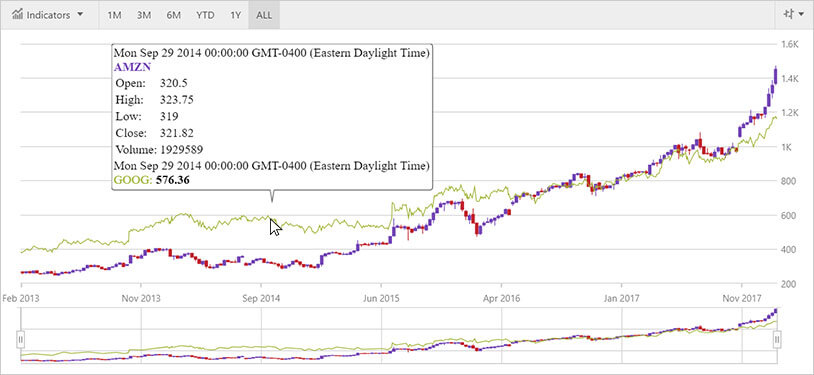
Crosshairs Annotation
Shows data point values at cursor location and renders these values in colored boxes over X and Y-axis labels.
 View Sample
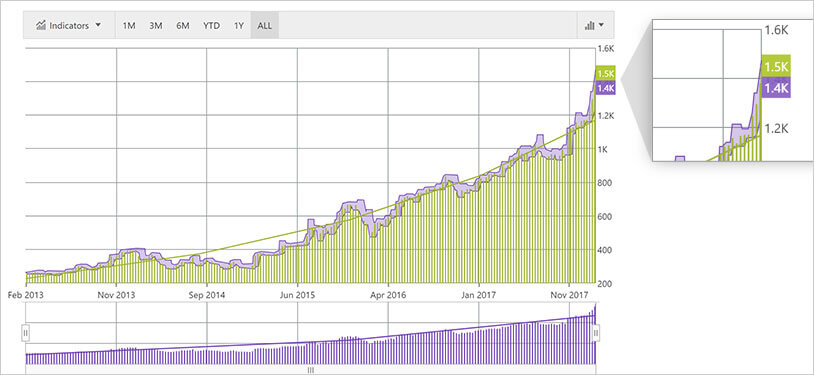
Final Value Annotation
Shows value of the last data point in your data source. Renders one colored box for each data source over Y-axis label.
 View Sample
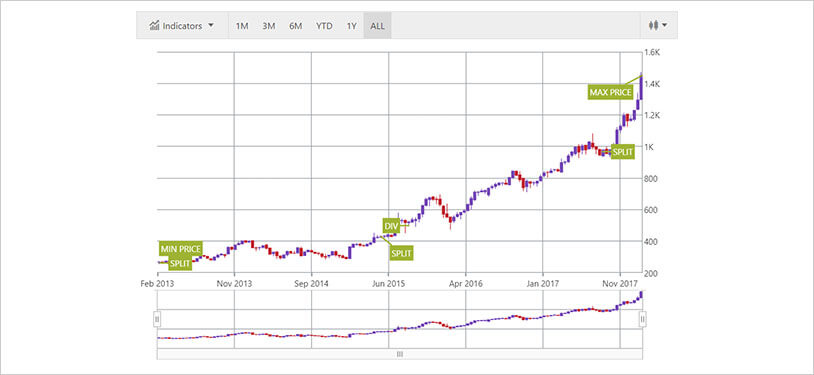
Callouts Layer
Annotate important data points or customize values in callout boxes based on your logic (i.e. calculate maximum values in your data source).
 View Sample
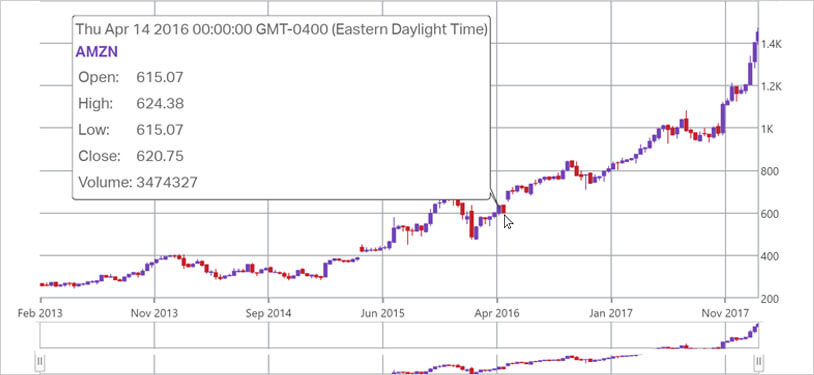
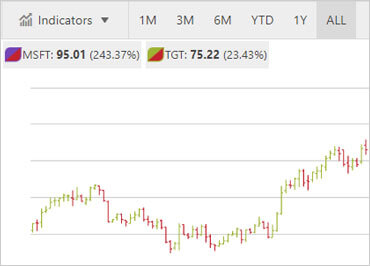
Legend
The Financial Chart comes with a built-in legend displayed between the toolbar and the plotting area. This legend shows data source titles, as well as the last value and percentage change between the first data item and the last data item.
View Sample